
| Name | Type | Description | Possible Values | Default Value |
| connected | boolean | Whether the points should be connected with a line. | true,false | false |
| forceEqualScales | boolean | Whether to force the x-axis and y-axis scaling to be the same. | true,false | false |
| horizontalViewAngle | int | Angle from which plot is viewed in degrees. | Any integer. | 20 |
| points | boolean | Whether point symbols should be plotted. | true,false | true |
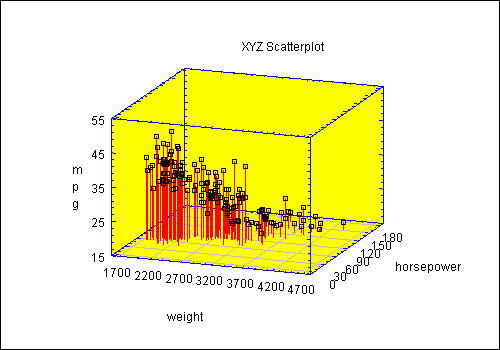
| threeDReferenceLine | String | Type of reference lines, if any, to be added to the plot. | "None", "Bottom", "Top", "Front", "Back", "Left", "Right" | "None" |
| threeDReferenceLineColor | Color | Color for drawing the reference line. | Any valid color. | Color.black |
| suppressXaxis | boolean | Whether to suppress display of the x-axis scaling and ticmarks. | true,false | false |
| suppressYaxis | boolean | Whether to suppress display of the y-axis scaling and ticmarks. | true,false | false |
| suppressZaxis | boolean | Whether to suppress display of the z-axis scaling and ticmarks. | true,false | false |
| tablewiseExclusion | boolean | Whether all rows of the data table containing a missing value in any column should be excluded from the plot. | true,false | false |
| verticalViewAngle | int | Angle from which plot is viewed in degrees. | Any integer. | 20 |
| xVariableName | String | The name of the column with data values to be plotted on the X axis. | Any string. | "X" |
| yVariableName | String | The name of the column with data values to be plotted on the Y axis. | Any string. | "Y" |
| zVariableName | String | The name of the column with data values to be plotted on the Z axis. | Any string. | "Z" |