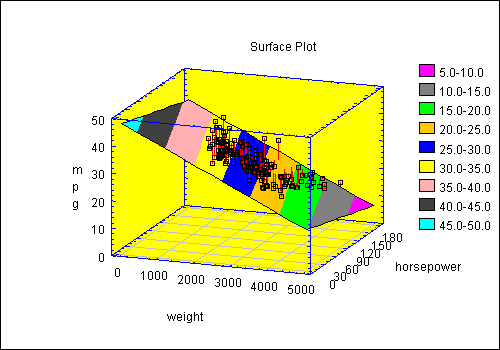

| Name | Type | Description | Possible Values | Default Value |
| addPoints | boolean | Whether to add points around the surface. | true,false | false |
| contoursBy | double | The distance between the contours. | Any double > 0. | missing |
| contoursFrom | double | The level at which the first contour should be plotted. | Any double. | missing (causes default scaling) |
| contoursTo | double | The level at which the last contour should be plotted. | Any double > contoursFrom. | missing |
| contourType | String | The type of contours to be plotted in the base. | "Lines", "Regions" | "Regions" |
| drawContoursBelow | boolean | Whether to draw contours in the base of the base. | true,false | false |
| gridSize | int | The number of values along each dimension of the matrix which defines the surface. | 2+ | 21 |
| horizontalViewAngle | int | Angle from which plot is viewed in degrees. | Any integer. | 20 |
| surfaceGrid | double[gridSize][gridSize] | An array containing the height of the surface. | Any double. | none |
| surfaceType | String | The type of surface to be plotted. | "Wireframe", "Solid", "Contoured" | "Wireframe" |
| threeDReferenceLineS | boolean | Whether to add lines from plotted points to the surface. | true,false | true |
| threeDReferenceLineColor | Color | Color for drawing the reference lines to the surface. | Any valid color. | Color.black |
| verticalViewAngle | int | Angle from which plot is viewed in degrees. | Any integer. | 20 |
| xMaximum | double | The maximum value of X in the grid matrix. | Any double > xMinimum. | 1.0 |
| xMinimum | double | The minimum value of X in the grid matrix. | Any double. | 0.0 |
| xVariableName | String | The name of the column with data values to be plotted (if any). | Any string. | "X" |
| yMaximum | double | The maximum value of Y in the grid matrix. | Any double > yMinimum. | 1.0 |
| yMinimum | double | The minimum value of Y in the grid matrix. | Any double. | 0.0 |
| yVariableName | String | The name of the column with data values to be plotted (if any). | Any string. | "Y" |
| zVariableName | String | The name of the column with data values to be plotted (if any). | Any string. | "Z" |