
| Name | Type | Description | Possible Values | Default Value |
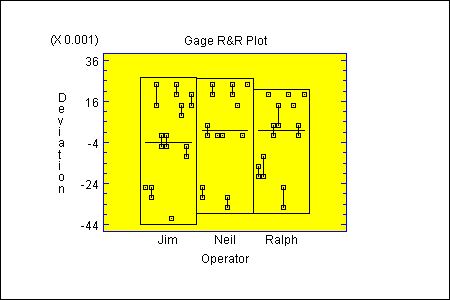
| chartType | String | The type of chart to plot. | "Average", "Range", "R&R". | "R&R" |
| controlLimitsColor | Color | The color of the range chart limit. | Any valid Color. | Color.red |
| rotateLabels | boolean | Whether to rotate the x-axis labels. | true,false | false |
| sigmaMultiple | double | Multiple of sigma used to place upper limit on range chart. | >0 | 3.0 |