StatBean Name: DexPlot

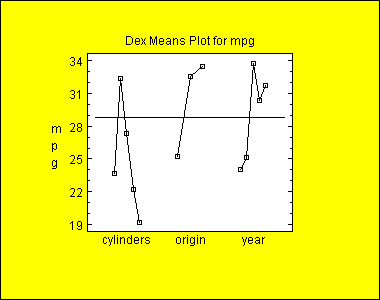
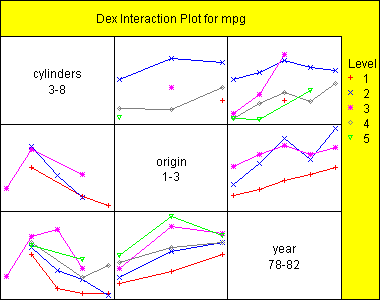
Purpose: Creates mean, standard deviation, and interaction plots for factors in a designed experiment.

DataSource: any.


Read/Write Properties
NameTypeDescriptionPossible ValuesDefault Value
connectedbooleanWhether the points should be connected with a line.true,falsefalse
includeVariableNameStringThe name of an optional column with values indicating which cases should be included (a non-zero value indicates inclusion).Any string.""
plotTypeStringFormat of plot."Means","Standard Deviations",
"Interactions"
"Means"
rotateClassLabelsbooleanWhether to make the bar labels vertical.true,falsefalse
tablewiseExclusionbooleanWhether all rows of the data table containing a missing value in any column should be excluded from the plot.true,falsefalse
xVariableNameStringThe name of the column with data values to be plotted.Any string.""

Other properties are inherited from the java.awt.Canvas class and from the general GraphicalStatbean class.

Code Sample

//create a datasource bean
FileDataSource fileDataSource1 = new STATBEANS.FileDataSource();

//set the file name to be read
fileDataSource1.setFileName("c:\\statbeans\\samples\\cardata.txt");

//create a chart bean
DexPlot plot1 = new STATBEANS.DexPlot();
plot1.setBackground(java.awt.Color.yellow);
plot1.setBounds(16,30,380,300);

//set the column to be plotted
plot1.setXVariableName("mpg");

//set the factor column
String temp[]=new String[3];
temp[0]="cylinders";
temp[1]="origin";
temp[2]="year";
plot1.setFactorVariableNames(temp);

//set the plot type
plot1.setPlotType("Means");

//add line connectors
plot1.setConnected(true);

//show the plot
add(plot1);

//make the plot bean a listener for changes in the FileDataSource bean
fileDataSource1.addDataChangeListener(plot1.listenerForDataChange);

//instruct the fileDataSource bean to read the file
fileDataSource1.readData();