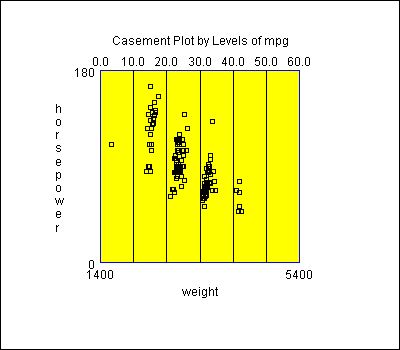
StatBean Name: CasementPlot

Purpose: - displays a series of X-Y scatterplots by levels of a third variable.

DataSource: Any.


Read/Write Properties
NameTypeDescriptionPossible ValuesDefault Value
gapdoubleThe proportion of the plotting space left blank around each side of the cells of the plot.0.0-0.250.1
missingValueExclusionStringThe method for handling records which contain missing values."Columnwise","Casewise",
"Tablewise"
"Columnwise"
xVariableNameStringThe name of the column with data values to be plotted on the X axis.Any string."X"
yVariableNameStringThe name of the column with data values to be plotted on the Y axis.Any string."Y"
zVariableNameStringThe name of the column with data values to be plotted on the Z axis.Any string."Z"

Other properties are inherited from the java.awt.Canvas class and from the general GraphicalStatbean class.

Code Sample

//create a datasource bean
FileDataSource fileDataSource1 = new STATBEANS.FileDataSource();

//set the file name to be read
fileDataSource1.setFileName("c:\\statbeans\\samples\\cardata.txt");

//create a plot bean
CasementPlot casementPlot1 = new STATBEANS.CasementPlot();

//set the columns names
casementPlot1.setXVariableName("weight");
casementPlot1.setYVariableName("horsepower");
casementPlot1.setZVariableName("mpg");

//add plot
add(casementPlot1);

//make the plot a listener for changes in the FileDataSource bean
fileDataSource1.addDataChangeListener(casementPlot1.listenerForDataChange);

//instruct the fileDataSource bean to read the file
fileDataSource1.readData();