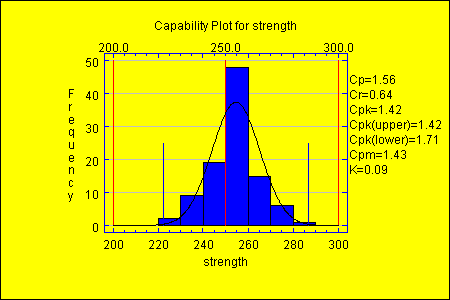
| Name | Type | Description | Possible Values | Default Value |
| by | double | Width of intervals. | Any double value > 0. | 0.1 |
| decimalPlaces | int | Number of decimal places for displaying limits. | 0+, or -1 for default. | -1 |
| fillColor | Color | Color to use for the bars. | Any valid Color. | Color.blue. |
| from | double | Lower limit for first interval. | Any double value. | 0.0 |
| includeCp | boolean | Whether to include the capability index in the table. | true,false | true |
| includeCpk | boolean | Whether to include the capability index in the table. | true,false | true |
| includeCpkLower | boolean | Whether to include the capability index in the table. | true,false | true |
| includeCpkUpper | boolean | Whether to include the capability index in the table. | true,false | true |
| includeCpm | boolean | Whether to include the capability index in the table. | true,false | true |
| includeCr | boolean | Whether to include the capability index in the table. | true,false | true |
| includeK | boolean | Whether to include the capability index in the table. | true,false | true |
| resolution | int | For continuous distributions, the number of points at which the function is calculated. | 50+ | 500 |
| showLimitValues | boolean | Whether to display the values for the spefication limits. | true,false | true |
| showSpecificationLimits | boolean | Whether to plot the specification limits. | true,false | true |
| showThreeSigmaLimits | boolean | Whether to plot the 3-sigma limits. | true,false | true |
| specificationLimitsColor | Color | The color of the control limits. | Any valid Color. | Color.red |
| threeSigmaLimitsColor | Color | The color of the 3-sigma limits. | Any valid Color. | Color.blue |
| to | double | Upper limit for last interval. | Double value > from. | 1.0 |

